vedo.dolfin
Submodule for support of the FEniCS/Dolfin library.
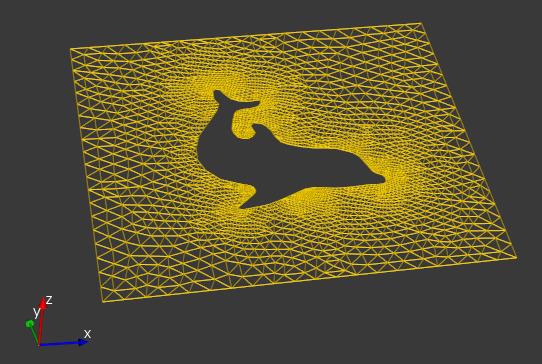
Example:
import dolfin
from vedo import dataurl, download
from vedo.dolfin import plot
fname = download(dataurl+"dolfin_fine.xml")
mesh = dolfin.Mesh(fname)
plot(mesh)
Find many more examples in directory vedo/examples/dolfin.
1#!/usr/bin/env python3 2# -*- coding: utf-8 -*- 3import numpy as np 4 5import vedo.vtkclasses as vtki 6 7import vedo 8from vedo.colors import printc 9from vedo import utils 10from vedo import shapes 11from vedo.mesh import Mesh 12from vedo.plotter import show 13 14__docformat__ = "google" 15 16__doc__ = """ 17Submodule for support of the [FEniCS/Dolfin](https://fenicsproject.org) library. 18 19Example: 20 ```python 21 import dolfin 22 from vedo import dataurl, download 23 from vedo.dolfin import plot 24 fname = download(dataurl+"dolfin_fine.xml") 25 mesh = dolfin.Mesh(fname) 26 plot(mesh) 27 ``` 28 29 30 31.. note:: 32 Find many more examples in directory 33 [vedo/examples/dolfin](https://github.com/marcomusy/vedo/blob/master/examples/other/dolfin). 34""" 35 36__all__ = ["plot"] 37 38 39########################################################################## 40def _inputsort(obj): 41 42 import dolfin 43 44 u = None 45 mesh = None 46 if not utils.is_sequence(obj): 47 obj = [obj] 48 49 for ob in obj: 50 inputtype = str(type(ob)) 51 52 # printc('inputtype is', inputtype, c=2) 53 54 if "vedo" in inputtype: # skip vtk objects, will be added later 55 continue 56 57 if "dolfin" in inputtype or "ufl" in inputtype: 58 if "MeshFunction" in inputtype: 59 mesh = ob.mesh() 60 61 if ob.dim() > 0: 62 printc("MeshFunction of dim>0 not supported.", c="r") 63 printc('Try e.g.: MeshFunction("size_t", mesh, 0)', c="r", italic=1) 64 printc('instead of MeshFunction("size_t", mesh, 1)', c="r", strike=1) 65 else: 66 # printc(ob.dim(), mesh.num_cells(), len(mesh.coordinates()), len(ob.array())) 67 V = dolfin.FunctionSpace(mesh, "CG", 1) 68 u = dolfin.Function(V) 69 v2d = dolfin.vertex_to_dof_map(V) 70 u.vector()[v2d] = ob.array() 71 elif "Function" in inputtype or "Expression" in inputtype: 72 u = ob 73 elif "ufl.mathfunctions" in inputtype: # not working 74 u = ob 75 elif "Mesh" in inputtype: 76 mesh = ob 77 elif "algebra" in inputtype: 78 mesh = ob.ufl_domain() 79 # print('algebra', ob.ufl_domain()) 80 81 if u and not mesh and hasattr(u, "function_space"): 82 V = u.function_space() 83 if V: 84 mesh = V.mesh() 85 if u and not mesh and hasattr(u, "mesh"): 86 mesh = u.mesh() 87 88 # printc('------------------------------------') 89 # printc('mesh.topology dim=', mesh.topology().dim()) 90 # printc('mesh.geometry dim=', mesh.geometry().dim()) 91 # if u: printc('u.value_rank()', u.value_rank()) 92 # if u and u.value_rank(): printc('u.value_dimension()', u.value_dimension(0)) # axis=0 93 ##if u: printc('u.value_shape()', u.value_shape()) 94 return (mesh, u) 95 96 97def _compute_uvalues(u, mesh): 98 # the whole purpose of this function is 99 # to have a scalar (or vector) for each point of the mesh 100 101 if not u: 102 return np.array([]) 103 # print('u',u) 104 105 if hasattr(u, "compute_vertex_values"): # old dolfin, works fine 106 u_values = u.compute_vertex_values(mesh) 107 108 if u.value_rank() and u.value_dimension(0) > 1: 109 l = u_values.shape[0] 110 u_values = u_values.reshape(u.value_dimension(0), int(l / u.value_dimension(0))).T 111 112 elif hasattr(u, "compute_point_values"): # dolfinx 113 u_values = u.compute_point_values() 114 115 try: 116 from dolfin import fem 117 118 fvec = u.vector 119 except RuntimeError: 120 fspace = u.function_space 121 try: 122 fspace = fspace.collapse() 123 except RuntimeError: 124 return [] 125 126 fvec = fem.interpolate(u, fspace).vector 127 128 tdim = mesh.topology.dim 129 130 # print('fvec.getSize', fvec.getSize(), mesh.num_entities(tdim)) 131 if fvec.getSize() == mesh.num_entities(tdim): 132 # DG0 cellwise function 133 C = fvec.get_local() 134 if C.dtype.type is np.complex128: 135 print("Plotting real part of complex data") 136 C = np.real(C) 137 138 u_values = C 139 140 else: 141 u_values = [] 142 143 if hasattr(mesh, "coordinates"): 144 coords = mesh.coordinates() 145 else: 146 coords = mesh.geometry.points 147 148 if u_values.shape[0] != coords.shape[0]: 149 vedo.logger.warning("mismatch in vedo.dolfin._compute_uvalues") 150 u_values = np.array([u(p) for p in coords]) 151 return u_values 152 153 154def plot(*inputobj, **options): 155 """ 156 Plot the object(s) provided. 157 158 Input can be any combination of: `Mesh`, `Volume`, `dolfin.Mesh`, 159 `dolfin.MeshFunction`, `dolfin.Expression` or `dolfin.Function`. 160 161 Return the current `Plotter` class instance. 162 163 Arguments: 164 mode : (str) 165 one or more of the following can be combined in any order 166 - `mesh`/`color`, will plot the mesh, by default colored with a scalar if available 167 - `displacement` show displaced mesh by solution 168 - `arrows`, mesh displacements are plotted as scaled arrows. 169 - `lines`, mesh displacements are plotted as scaled lines. 170 - `tensors`, to be implemented 171 add : (bool) 172 add the input objects without clearing the already plotted ones 173 density : (float) 174 show only a subset of lines or arrows [0-1] 175 wire[frame] : (bool) 176 visualize mesh as wireframe [False] 177 c[olor] : (color) 178 set mesh color [None] 179 exterior : (bool) 180 only show the outer surface of the mesh [False] 181 alpha : (float) 182 set object's transparency [1] 183 lw : (int) 184 line width of the mesh (set to zero to hide mesh) [0.1] 185 ps : int 186 set point size of mesh vertices [None] 187 z : (float) 188 add a constant to z-coordinate (useful to show 2D slices as function of time) 189 legend : (str) 190 add a legend to the top-right of window [None] 191 scalarbar : (bool) 192 add a scalarbar to the window ['vertical'] 193 vmin : (float) 194 set the minimum for the range of the scalar [None] 195 vmax : (float) 196 set the maximum for the range of the scalar [None] 197 scale : (float) 198 add a scaling factor to arrows and lines sizes [1] 199 cmap : (str) 200 choose a color map for scalars 201 shading : (str) 202 mesh shading ['flat', 'phong'] 203 text : (str) 204 add a gray text comment to the top-left of the window [None] 205 isolines : (dict) 206 dictionary of isolines properties 207 - n, (int) - add this number of isolines to the mesh 208 - c, - isoline color 209 - lw, (float) - isoline width 210 - z, (float) - add to the isoline z coordinate to make them more visible 211 warp_zfactor : (float) 212 elevate z-axis by scalar value (useful for 2D geometries) 213 warp_yfactor : (float) 214 elevate z-axis by scalar value (useful for 1D geometries) 215 scale_mesh_factors : (list) 216 rescale mesh by these factors [1,1,1] 217 new : (bool) 218 spawn a new instance of Plotter class, pops up a new window 219 at : (int) 220 renderer number to plot to 221 shape : (list) 222 subdvide window in (n,m) rows and columns 223 N : (int) 224 automatically subdvide window in N renderers 225 pos : (list) 226 (x,y) coordinates of the window position on screen 227 size : (list) 228 window size (x,y) 229 title : (str) 230 window title 231 bg : (color) 232 background color name of window 233 bg2 : (color) 234 second background color name to create a color gradient 235 style : (int) 236 choose a predefined style [0-4] 237 - 0, `vedo`, style (blackboard background, rainbow color map) 238 - 1, `matplotlib`, style (white background, viridis color map) 239 - 2, `paraview`, style 240 - 3, `meshlab`, style 241 - 4, `bw`, black and white style. 242 axes : (int) 243 Axes type number. 244 Axes type-1 can be fully customized by passing a dictionary `axes=dict()`. 245 - 0, no axes, 246 - 1, draw customizable grid axes (see below). 247 - 2, show cartesian axes from (0,0,0) 248 - 3, show positive range of cartesian axes from (0,0,0) 249 - 4, show a triad at bottom left 250 - 5, show a cube at bottom left 251 - 6, mark the corners of the bounding box 252 - 7, draw a simple ruler at the bottom of the window 253 - 8, show the `vtkCubeAxesActor` object, 254 - 9, show the bounding box outLine, 255 - 10, show three circles representing the maximum bounding box, 256 - 11, show a large grid on the x-y plane (use with zoom=8) 257 - 12, show polar axes. 258 infinity : (bool) 259 if True fugue point is set at infinity (no perspective effects) 260 sharecam : (bool) 261 if False each renderer will have an independent vtkCamera 262 interactive : (bool) 263 if True will stop after show() to allow interaction w/ window 264 offscreen : (bool) 265 if True will not show the rendering window 266 zoom : (float) 267 camera zooming factor 268 viewup : (list), str 269 camera view-up direction ['x','y','z', or a vector direction] 270 azimuth : (float) 271 add azimuth rotation of the scene, in degrees 272 elevation : (float) 273 add elevation rotation of the scene, in degrees 274 roll : (float) 275 add roll-type rotation of the scene, in degrees 276 camera : (dict) 277 Camera parameters can further be specified with a dictionary 278 assigned to the `camera` keyword: 279 (E.g. `show(camera={'pos':(1,2,3), 'thickness':1000,})`) 280 - `pos`, `(list)`, 281 the position of the camera in world coordinates 282 - `focal_point`, `(list)`, 283 the focal point of the camera in world coordinates 284 - `viewup`, `(list)`, 285 the view up direction for the camera 286 - `distance`, `(float)`, 287 set the focal point to the specified distance from the camera position. 288 - `clipping_range`, `(float)`, 289 distance of the near and far clipping planes along the direction of projection. 290 - `parallel_scale`, `(float)`, 291 scaling used for a parallel projection, i.e. the height of the viewport 292 in world-coordinate distances. The default is 1. Note that the "scale" parameter works as 293 an "inverse scale", larger numbers produce smaller images. 294 This method has no effect in perspective projection mode. 295 - `thickness`, `(float)`, 296 set the distance between clipping planes. This method adjusts the far clipping 297 plane to be set a distance 'thickness' beyond the near clipping plane. 298 - `view_angle`, `(float)`, 299 the camera view angle, which is the angular height of the camera view 300 measured in degrees. The default angle is 30 degrees. 301 This method has no effect in parallel projection mode. 302 The formula for setting the angle up for perfect perspective viewing is: 303 angle = 2*atan((h/2)/d) where h is the height of the RenderWindow 304 (measured by holding a ruler up to your screen) and d is the distance 305 from your eyes to the screen. 306 """ 307 if len(inputobj) == 0: 308 vedo.plotter_instance.interactive() 309 return None 310 311 if "numpy" in str(type(inputobj[0])): 312 from vedo.pyplot import plot as pyplot_plot 313 314 return pyplot_plot(*inputobj, **options) 315 316 mesh, u = _inputsort(inputobj) 317 318 mode = options.pop("mode", "mesh") 319 ttime = options.pop("z", None) 320 321 add = options.pop("add", False) 322 323 wire = options.pop("wireframe", None) 324 325 c = options.pop("c", None) 326 color = options.pop("color", None) 327 if color is not None: 328 c = color 329 330 lc = options.pop("lc", None) 331 332 alpha = options.pop("alpha", 1) 333 lw = options.pop("lw", 0.5) 334 ps = options.pop("ps", None) 335 legend = options.pop("legend", None) 336 scbar = options.pop("scalarbar", "v") 337 vmin = options.pop("vmin", None) 338 vmax = options.pop("vmax", None) 339 cmap = options.pop("cmap", None) 340 scale = options.pop("scale", 1) 341 scale_mesh_factors = options.pop("scale_mesh_factors", [1, 1, 1]) 342 shading = options.pop("shading", "phong") 343 text = options.pop("text", None) 344 style = options.pop("style", "vtk") 345 isolns = options.pop("isolines", {}) 346 warp_zfactor = options.pop("warp_zfactor", None) 347 warp_yfactor = options.pop("warp_yfactor", None) 348 lighting = options.pop("lighting", None) 349 exterior = options.pop("exterior", False) 350 returnActorsNoShow = options.pop("returnActorsNoShow", False) 351 at = options.pop("at", 0) 352 353 # refresh axes titles for axes type = 8 (vtkCubeAxesActor) 354 xtitle = options.pop("xtitle", "x") 355 ytitle = options.pop("ytitle", "y") 356 ztitle = options.pop("ztitle", "z") 357 if vedo.plotter_instance: 358 if xtitle != "x": 359 aet = vedo.plotter_instance.axes_instances 360 if len(aet) > at and isinstance(aet[at], vtki.get_class("CubeAxesActor")): 361 aet[at].SetXTitle(xtitle) 362 if ytitle != "y": 363 aet = vedo.plotter_instance.axes_instances 364 if len(aet) > at and isinstance(aet[at], vtki.get_class("CubeAxesActor")): 365 aet[at].SetYTitle(ytitle) 366 if ztitle != "z": 367 aet = vedo.plotter_instance.axes_instances 368 if len(aet) > at and isinstance(aet[at], vtki.get_class("CubeAxesActor")): 369 aet[at].SetZTitle(ztitle) 370 371 # change some default to emulate standard behaviours 372 if style in (0, "vtk"): 373 axes = options.pop("axes", None) 374 if axes is None: 375 options["axes"] = {"xygrid": False, "yzgrid": False, "zxgrid": False} 376 else: 377 options["axes"] = axes # put back 378 if cmap is None: 379 cmap = "rainbow" 380 elif style in (1, "matplotlib"): 381 bg = options.pop("bg", None) 382 if bg is None: 383 options["bg"] = "white" 384 else: 385 options["bg"] = bg 386 axes = options.pop("axes", None) 387 if axes is None: 388 options["axes"] = {"xygrid": False, "yzgrid": False, "zxgrid": False} 389 else: 390 options["axes"] = axes # put back 391 if cmap is None: 392 cmap = "viridis" 393 elif style in (2, "paraview"): 394 bg = options.pop("bg", None) 395 if bg is None: 396 options["bg"] = (82, 87, 110) 397 else: 398 options["bg"] = bg 399 if cmap is None: 400 cmap = "coolwarm" 401 elif style in (3, "meshlab"): 402 bg = options.pop("bg", None) 403 if bg is None: 404 options["bg"] = (8, 8, 16) 405 options["bg2"] = (117, 117, 234) 406 else: 407 options["bg"] = bg 408 axes = options.pop("axes", None) 409 if axes is None: 410 options["axes"] = 10 411 else: 412 options["axes"] = axes # put back 413 if cmap is None: 414 cmap = "afmhot" 415 elif style in (4, "bw"): 416 bg = options.pop("bg", None) 417 if bg is None: 418 options["bg"] = (217, 255, 238) 419 else: 420 options["bg"] = bg 421 axes = options.pop("axes", None) 422 if axes is None: 423 options["axes"] = {"xygrid": False, "yzgrid": False, "zxgrid": False} 424 else: 425 options["axes"] = axes # put back 426 if cmap is None: 427 cmap = "binary" 428 429 ################################################################# 430 actors = [] 431 if vedo.plotter_instance: 432 if add: 433 actors = vedo.plotter_instance.actors 434 435 if mesh and ("mesh" in mode or "color" in mode or "displace" in mode): 436 437 msh = IMesh(u, mesh, exterior=exterior) 438 439 msh.wireframe(wire) 440 msh.scale(scale_mesh_factors) 441 if lighting: 442 msh.lighting(lighting) 443 if ttime: 444 msh.z(ttime) 445 if legend: 446 msh.legend(legend) 447 if c: 448 msh.color(c) 449 if lc: 450 msh.linecolor(lc) 451 if alpha: 452 alpha = min(alpha, 1) 453 msh.alpha(alpha * alpha) 454 if lw: 455 msh.linewidth(lw) 456 if wire and alpha: 457 lw1 = min(lw, 1) 458 msh.alpha(alpha * lw1) 459 if ps: 460 msh.point_size(ps) 461 if shading: 462 if shading == "phong": 463 msh.phong() 464 elif shading == "flat": 465 msh.flat() 466 elif shading[0] == "g": 467 msh.phong() 468 469 if "displace" in mode: 470 msh.move(u) 471 472 if cmap and (msh.u_values is not None) and len(msh.u_values)>0 and c is None: 473 if msh.u_values.ndim > 1: 474 msh.cmap(cmap, utils.mag(msh.u_values), vmin=vmin, vmax=vmax) 475 else: 476 msh.cmap(cmap, msh.u_values, vmin=vmin, vmax=vmax) 477 478 if warp_yfactor: 479 scals = msh.pointdata[0] 480 if len(scals) > 0: 481 pts_act = msh.coordinates 482 pts_act[:, 1] = scals * warp_yfactor * scale_mesh_factors[1] 483 if warp_zfactor: 484 scals = msh.pointdata[0] 485 if len(scals) > 0: 486 pts_act = msh.coordinates 487 pts_act[:, 2] = scals * warp_zfactor * scale_mesh_factors[2] 488 if warp_yfactor or warp_zfactor: 489 # msh.points(pts_act) 490 msh.coordinates = pts_act 491 if vmin is not None and vmax is not None: 492 msh.mapper.SetScalarRange(vmin, vmax) 493 494 if scbar and c is None: 495 if "3d" in scbar: 496 msh.add_scalarbar3d() 497 elif "h" in scbar: 498 msh.add_scalarbar(horizontal=True) 499 else: 500 msh.add_scalarbar(horizontal=False) 501 502 if len(isolns) > 0: 503 ison = isolns.pop("n", 10) 504 isocol = isolns.pop("c", "black") 505 isoalpha = isolns.pop("alpha", 1) 506 isolw = isolns.pop("lw", 1) 507 508 isos = msh.isolines(n=ison).color(isocol).lw(isolw).alpha(isoalpha) 509 510 isoz = isolns.pop("z", None) 511 if isoz is not None: # kind of hack to make isolines visible on flat meshes 512 d = isoz 513 else: 514 d = msh.diagonal_size() / 400 515 isos.z(msh.z() + d) 516 actors.append(isos) 517 518 actors.append(msh) 519 520 521 ################################################################# 522 if "arrow" in mode or "line" in mode: 523 if "arrow" in mode: 524 arrs = create_arrows(u, scale=scale) 525 else: 526 arrs = create_lines(u, scale=scale) 527 528 if arrs: 529 if legend and "mesh" not in mode: 530 arrs.legend(legend) 531 if c: 532 arrs.color(c) 533 arrs.color(c) 534 if alpha: 535 arrs.alpha(alpha) 536 actors.append(arrs) 537 538 ################################################################# 539 for ob in inputobj: 540 inputtype = str(type(ob)) 541 if "vedo" in inputtype: 542 actors.append(ob) 543 544 if text: 545 actors.append(text) 546 547 if "at" in options and "interactive" not in options: 548 if vedo.plotter_instance: 549 N = vedo.plotter_instance.shape[0] * vedo.plotter_instance.shape[1] 550 if options["at"] == N - 1: 551 options["interactive"] = True 552 553 if len(actors) == 0: 554 print('Warning: no objects to show, check mode in plot(mode="...")') 555 556 if returnActorsNoShow: 557 return actors 558 559 return show(actors, **options) 560 561 562################################################################################### 563class IMesh(Mesh): 564 """Interface Mesh representation for dolfin.""" 565 566 def __init__(self, *inputobj, **options): 567 """A `vedo.Mesh` derived object for dolfin support.""" 568 569 c = options.pop("c", None) 570 alpha = options.pop("alpha", 1) 571 exterior = options.pop("exterior", False) 572 compute_normals = options.pop("compute_normals", False) 573 574 mesh, u = _inputsort(inputobj) 575 if not mesh: 576 return 577 578 if exterior: 579 import dolfin 580 581 meshc = dolfin.BoundaryMesh(mesh, "exterior") 582 else: 583 meshc = mesh 584 585 if hasattr(mesh, "coordinates"): 586 coords = mesh.coordinates() 587 else: 588 coords = mesh.geometry.points 589 590 cells = meshc.cells() 591 592 if cells.shape[1] == 4: 593 poly = vtki.vtkPolyData() 594 595 source_points = vtki.vtkPoints() 596 source_points.SetData(utils.numpy2vtk(coords, dtype=np.float32)) 597 poly.SetPoints(source_points) 598 599 source_polygons = vtki.vtkCellArray() 600 for f in cells: 601 # do not use vtkTetra() because it fails 602 # with dolfin faces orientation 603 ele0 = vtki.vtkTriangle() 604 ele1 = vtki.vtkTriangle() 605 ele2 = vtki.vtkTriangle() 606 ele3 = vtki.vtkTriangle() 607 608 f0, f1, f2, f3 = f 609 pid0 = ele0.GetPointIds() 610 pid1 = ele1.GetPointIds() 611 pid2 = ele2.GetPointIds() 612 pid3 = ele3.GetPointIds() 613 614 pid0.SetId(0, f0) 615 pid0.SetId(1, f1) 616 pid0.SetId(2, f2) 617 618 pid1.SetId(0, f0) 619 pid1.SetId(1, f1) 620 pid1.SetId(2, f3) 621 622 pid2.SetId(0, f1) 623 pid2.SetId(1, f2) 624 pid2.SetId(2, f3) 625 626 pid3.SetId(0, f2) 627 pid3.SetId(1, f3) 628 pid3.SetId(2, f0) 629 630 source_polygons.InsertNextCell(ele0) 631 source_polygons.InsertNextCell(ele1) 632 source_polygons.InsertNextCell(ele2) 633 source_polygons.InsertNextCell(ele3) 634 635 poly.SetPolys(source_polygons) 636 637 else: 638 poly = utils.buildPolyData(coords, cells) 639 640 super().__init__(poly, c, alpha) 641 642 if compute_normals: 643 self.compute_normals() 644 645 self.mesh = mesh # holds a dolfin Mesh obj 646 self.u = u # holds a dolfin function_data 647 # holds the actual values of u on the mesh 648 self.u_values = _compute_uvalues(u, mesh) 649 650 ##################################### 651 def move(self, u=None, deltas=None): 652 """Move mesh according to solution `u` or from calculated vertex displacements `deltas`.""" 653 if u is None: 654 u = self.u 655 if deltas is None: 656 if self.u_values is not None: 657 deltas = self.u_values 658 else: 659 deltas = _compute_uvalues(u, self.mesh) 660 self.u_values = deltas 661 662 if hasattr(self.mesh, "coordinates"): 663 coords = self.mesh.coordinates() 664 else: 665 coords = self.mesh.geometry.points 666 667 if coords.shape != deltas.shape: 668 vedo.logger.error( 669 f"Try to move mesh with wrong solution type shape {coords.shape} vs {deltas.shape}" 670 ) 671 vedo.logger.error("Mesh is not moved. Try mode='color' in plot().") 672 return 673 674 movedpts = coords + deltas 675 if movedpts.shape[1] == 2: # 2d 676 movedpts = np.c_[movedpts, np.zeros(movedpts.shape[0])] 677 self.dataset.GetPoints().SetData(utils.numpy2vtk(movedpts, dtype=np.float32)) 678 self.dataset.GetPoints().Modified() 679 680################################################################################### 681def create_lines(*inputobj, **options): 682 """ 683 Build the line segments between two lists of points `start_points` and `end_points`. 684 `start_points` can be also passed in the form `[[point1, point2], ...]`. 685 686 A dolfin `Mesh` that was deformed/modified by a function can be 687 passed together as inputs. 688 689 Use `scale` to apply a rescaling factor to the length 690 """ 691 scale = options.pop("scale", 1) 692 lw = options.pop("lw", 1) 693 c = options.pop("c", "grey") 694 alpha = options.pop("alpha", 1) 695 696 mesh, u = _inputsort(inputobj) 697 if not mesh: 698 return None 699 700 if hasattr(mesh, "coordinates"): 701 start_points = mesh.coordinates() 702 else: 703 start_points = mesh.geometry.points 704 705 u_values = _compute_uvalues(u, mesh) 706 if not utils.is_sequence(u_values[0]): 707 vedo.logger.error("cannot show Lines for 1D scalar values") 708 raise RuntimeError() 709 710 end_points = start_points + u_values 711 if u_values.shape[1] == 2: # u_values is 2D 712 u_values = np.insert(u_values, 2, 0, axis=1) # make it 3d 713 start_points = np.insert(start_points, 2, 0, axis=1) # make it 3d 714 end_points = np.insert(end_points, 2, 0, axis=1) # make it 3d 715 716 lines = shapes.Lines(start_points, end_points, scale=scale, lw=lw, c=c, alpha=alpha) 717 718 lines.mesh = mesh 719 lines.u = u 720 lines.u_values = u_values 721 return lines 722 723################################################################################### 724def create_arrows(*inputobj, **options): 725 """Build arrows representing displacements.""" 726 s = options.pop("s", None) 727 c = options.pop("c", "k3") 728 scale = options.pop("scale", 1) 729 alpha = options.pop("alpha", 1) 730 res = options.pop("res", 12) 731 732 mesh, u = _inputsort(inputobj) 733 if not mesh: 734 return None 735 736 if hasattr(mesh, "coordinates"): 737 start_points = mesh.coordinates() 738 else: 739 start_points = mesh.geometry.points 740 741 u_values = _compute_uvalues(u, mesh) 742 if not utils.is_sequence(u_values[0]): 743 vedo.logger.error("cannot show Arrows for 1D scalar values") 744 raise RuntimeError() 745 746 end_points = start_points + u_values * scale 747 if u_values.shape[1] == 2: # u_values is 2D 748 u_values = np.insert(u_values, 2, 0, axis=1) # make it 3d 749 start_points = np.insert(start_points, 2, 0, axis=1) # make it 3d 750 end_points = np.insert(end_points, 2, 0, axis=1) # make it 3d 751 752 obj = shapes.Arrows(start_points, end_points, s=s, alpha=alpha, c=c, res=res) 753 obj.mesh = mesh 754 obj.u = u 755 obj.u_values = u_values 756 return obj
def
plot(*inputobj, **options):
155def plot(*inputobj, **options):
156    """
157    Plot the object(s) provided.
158
159    Input can be any combination of: `Mesh`, `Volume`, `dolfin.Mesh`,
160    `dolfin.MeshFunction`, `dolfin.Expression` or `dolfin.Function`.
161
162    Return the current `Plotter` class instance.
163
164    Arguments:
165        mode : (str)
166            one or more of the following can be combined in any order
167            - `mesh`/`color`, will plot the mesh, by default colored with a scalar if available
168            - `displacement` show displaced mesh by solution
169            - `arrows`, mesh displacements are plotted as scaled arrows.
170            - `lines`, mesh displacements are plotted as scaled lines.
171            - `tensors`, to be implemented
172        add : (bool)
173            add the input objects without clearing the already plotted ones
174        density : (float)
175            show only a subset of lines or arrows [0-1]
176        wire[frame] : (bool)
177            visualize mesh as wireframe [False]
178        c[olor] : (color)
179            set mesh color [None]
180        exterior : (bool)
181            only show the outer surface of the mesh [False]
182        alpha : (float)
183            set object's transparency [1]
184        lw : (int)
185            line width of the mesh (set to zero to hide mesh) [0.1]
186        ps :  int
187            set point size of mesh vertices [None]
188        z : (float)
189            add a constant to z-coordinate (useful to show 2D slices as function of time)
190        legend : (str)
191            add a legend to the top-right of window [None]
192        scalarbar : (bool)
193            add a scalarbar to the window ['vertical']
194        vmin : (float)
195            set the minimum for the range of the scalar [None]
196        vmax : (float)
197            set the maximum for the range of the scalar [None]
198        scale : (float)
199            add a scaling factor to arrows and lines sizes [1]
200        cmap : (str)
201            choose a color map for scalars
202        shading : (str)
203            mesh shading ['flat', 'phong']
204        text : (str)
205            add a gray text comment to the top-left of the window [None]
206        isolines : (dict)
207            dictionary of isolines properties
208            - n, (int) - add this number of isolines to the mesh
209            - c, - isoline color
210            - lw, (float) - isoline width
211            - z, (float) - add to the isoline z coordinate to make them more visible
212        warp_zfactor : (float)
213            elevate z-axis by scalar value (useful for 2D geometries)
214        warp_yfactor : (float)
215            elevate z-axis by scalar value (useful for 1D geometries)
216        scale_mesh_factors : (list)
217            rescale mesh by these factors [1,1,1]
218        new : (bool)
219            spawn a new instance of Plotter class, pops up a new window
220        at : (int)
221            renderer number to plot to
222        shape : (list)
223            subdvide window in (n,m) rows and columns
224        N : (int)
225            automatically subdvide window in N renderers
226        pos : (list)
227            (x,y) coordinates of the window position on screen
228        size : (list)
229            window size (x,y)
230        title : (str)
231            window title
232        bg : (color)
233            background color name of window
234        bg2 : (color)
235            second background color name to create a color gradient
236        style : (int)
237            choose a predefined style [0-4]
238            - 0, `vedo`, style (blackboard background, rainbow color map)
239            - 1, `matplotlib`, style (white background, viridis color map)
240            - 2, `paraview`, style
241            - 3, `meshlab`, style
242            - 4, `bw`, black and white style.
243        axes : (int)
244            Axes type number.
245            Axes type-1 can be fully customized by passing a dictionary `axes=dict()`.
246            - 0,  no axes,
247            - 1,  draw customizable grid axes (see below).
248            - 2,  show cartesian axes from (0,0,0)
249            - 3,  show positive range of cartesian axes from (0,0,0)
250            - 4,  show a triad at bottom left
251            - 5,  show a cube at bottom left
252            - 6,  mark the corners of the bounding box
253            - 7,  draw a simple ruler at the bottom of the window
254            - 8,  show the `vtkCubeAxesActor` object,
255            - 9,  show the bounding box outLine,
256            - 10, show three circles representing the maximum bounding box,
257            - 11, show a large grid on the x-y plane (use with zoom=8)
258            - 12, show polar axes.
259        infinity : (bool)
260            if True fugue point is set at infinity (no perspective effects)
261        sharecam : (bool)
262            if False each renderer will have an independent vtkCamera
263        interactive : (bool)
264            if True will stop after show() to allow interaction w/ window
265        offscreen : (bool)
266            if True will not show the rendering window
267        zoom : (float)
268            camera zooming factor
269        viewup : (list), str
270            camera view-up direction ['x','y','z', or a vector direction]
271        azimuth : (float)
272            add azimuth rotation of the scene, in degrees
273        elevation : (float)
274            add elevation rotation of the scene, in degrees
275        roll : (float)
276            add roll-type rotation of the scene, in degrees
277        camera : (dict)
278            Camera parameters can further be specified with a dictionary
279            assigned to the `camera` keyword:
280            (E.g. `show(camera={'pos':(1,2,3), 'thickness':1000,})`)
281            - `pos`, `(list)`,
282                the position of the camera in world coordinates
283            - `focal_point`, `(list)`,
284                the focal point of the camera in world coordinates
285            - `viewup`, `(list)`,
286                the view up direction for the camera
287            - `distance`, `(float)`,
288                set the focal point to the specified distance from the camera position.
289            - `clipping_range`, `(float)`,
290                distance of the near and far clipping planes along the direction of projection.
291            - `parallel_scale`, `(float)`,
292                scaling used for a parallel projection, i.e. the height of the viewport
293                in world-coordinate distances. The default is 1. Note that the "scale" parameter works as
294                an "inverse scale", larger numbers produce smaller images.
295                This method has no effect in perspective projection mode.
296            - `thickness`, `(float)`,
297                set the distance between clipping planes. This method adjusts the far clipping
298                plane to be set a distance 'thickness' beyond the near clipping plane.
299            - `view_angle`, `(float)`,
300                the camera view angle, which is the angular height of the camera view
301                measured in degrees. The default angle is 30 degrees.
302                This method has no effect in parallel projection mode.
303                The formula for setting the angle up for perfect perspective viewing is:
304                angle = 2*atan((h/2)/d) where h is the height of the RenderWindow
305                (measured by holding a ruler up to your screen) and d is the distance
306                from your eyes to the screen.
307    """
308    if len(inputobj) == 0:
309        vedo.plotter_instance.interactive()
310        return None
311
312    if "numpy" in str(type(inputobj[0])):
313        from vedo.pyplot import plot as pyplot_plot
314
315        return pyplot_plot(*inputobj, **options)
316
317    mesh, u = _inputsort(inputobj)
318
319    mode = options.pop("mode", "mesh")
320    ttime = options.pop("z", None)
321
322    add = options.pop("add", False)
323
324    wire = options.pop("wireframe", None)
325
326    c = options.pop("c", None)
327    color = options.pop("color", None)
328    if color is not None:
329        c = color
330
331    lc = options.pop("lc", None)
332
333    alpha = options.pop("alpha", 1)
334    lw = options.pop("lw", 0.5)
335    ps = options.pop("ps", None)
336    legend = options.pop("legend", None)
337    scbar = options.pop("scalarbar", "v")
338    vmin = options.pop("vmin", None)
339    vmax = options.pop("vmax", None)
340    cmap = options.pop("cmap", None)
341    scale = options.pop("scale", 1)
342    scale_mesh_factors = options.pop("scale_mesh_factors", [1, 1, 1])
343    shading = options.pop("shading", "phong")
344    text = options.pop("text", None)
345    style = options.pop("style", "vtk")
346    isolns = options.pop("isolines", {})
347    warp_zfactor = options.pop("warp_zfactor", None)
348    warp_yfactor = options.pop("warp_yfactor", None)
349    lighting = options.pop("lighting", None)
350    exterior = options.pop("exterior", False)
351    returnActorsNoShow = options.pop("returnActorsNoShow", False)
352    at = options.pop("at", 0)
353
354    # refresh axes titles for axes type = 8 (vtkCubeAxesActor)
355    xtitle = options.pop("xtitle", "x")
356    ytitle = options.pop("ytitle", "y")
357    ztitle = options.pop("ztitle", "z")
358    if vedo.plotter_instance:
359        if xtitle != "x":
360            aet = vedo.plotter_instance.axes_instances
361            if len(aet) > at and isinstance(aet[at], vtki.get_class("CubeAxesActor")):
362                aet[at].SetXTitle(xtitle)
363        if ytitle != "y":
364            aet = vedo.plotter_instance.axes_instances
365            if len(aet) > at and isinstance(aet[at], vtki.get_class("CubeAxesActor")):
366                aet[at].SetYTitle(ytitle)
367        if ztitle != "z":
368            aet = vedo.plotter_instance.axes_instances
369            if len(aet) > at and isinstance(aet[at], vtki.get_class("CubeAxesActor")):
370                aet[at].SetZTitle(ztitle)
371
372    # change some default to emulate standard behaviours
373    if style in (0, "vtk"):
374        axes = options.pop("axes", None)
375        if axes is None:
376            options["axes"] = {"xygrid": False, "yzgrid": False, "zxgrid": False}
377        else:
378            options["axes"] = axes  # put back
379        if cmap is None:
380            cmap = "rainbow"
381    elif style in (1, "matplotlib"):
382        bg = options.pop("bg", None)
383        if bg is None:
384            options["bg"] = "white"
385        else:
386            options["bg"] = bg
387        axes = options.pop("axes", None)
388        if axes is None:
389            options["axes"] = {"xygrid": False, "yzgrid": False, "zxgrid": False}
390        else:
391            options["axes"] = axes  # put back
392        if cmap is None:
393            cmap = "viridis"
394    elif style in (2, "paraview"):
395        bg = options.pop("bg", None)
396        if bg is None:
397            options["bg"] = (82, 87, 110)
398        else:
399            options["bg"] = bg
400        if cmap is None:
401            cmap = "coolwarm"
402    elif style in (3, "meshlab"):
403        bg = options.pop("bg", None)
404        if bg is None:
405            options["bg"] = (8, 8, 16)
406            options["bg2"] = (117, 117, 234)
407        else:
408            options["bg"] = bg
409        axes = options.pop("axes", None)
410        if axes is None:
411            options["axes"] = 10
412        else:
413            options["axes"] = axes  # put back
414        if cmap is None:
415            cmap = "afmhot"
416    elif style in (4, "bw"):
417        bg = options.pop("bg", None)
418        if bg is None:
419            options["bg"] = (217, 255, 238)
420        else:
421            options["bg"] = bg
422        axes = options.pop("axes", None)
423        if axes is None:
424            options["axes"] = {"xygrid": False, "yzgrid": False, "zxgrid": False}
425        else:
426            options["axes"] = axes  # put back
427        if cmap is None:
428            cmap = "binary"
429
430    #################################################################
431    actors = []
432    if vedo.plotter_instance:
433        if add:
434            actors = vedo.plotter_instance.actors
435
436    if mesh and ("mesh" in mode or "color" in mode or "displace" in mode):
437
438        msh = IMesh(u, mesh, exterior=exterior)
439
440        msh.wireframe(wire)
441        msh.scale(scale_mesh_factors)
442        if lighting:
443            msh.lighting(lighting)
444        if ttime:
445            msh.z(ttime)
446        if legend:
447            msh.legend(legend)
448        if c:
449            msh.color(c)
450        if lc:
451            msh.linecolor(lc)
452        if alpha:
453            alpha = min(alpha, 1)
454            msh.alpha(alpha * alpha)
455        if lw:
456            msh.linewidth(lw)
457            if wire and alpha:
458                lw1 = min(lw, 1)
459                msh.alpha(alpha * lw1)
460        if ps:
461            msh.point_size(ps)
462        if shading:
463            if shading == "phong":
464                msh.phong()
465            elif shading == "flat":
466                msh.flat()
467            elif shading[0] == "g":
468                msh.phong()
469
470        if "displace" in mode:
471            msh.move(u)
472
473        if cmap and (msh.u_values is not None) and len(msh.u_values)>0 and c is None:
474            if msh.u_values.ndim > 1:
475                msh.cmap(cmap, utils.mag(msh.u_values), vmin=vmin, vmax=vmax)
476            else:
477                msh.cmap(cmap, msh.u_values, vmin=vmin, vmax=vmax)
478
479        if warp_yfactor:
480            scals = msh.pointdata[0]
481            if len(scals) > 0:
482                pts_act = msh.coordinates
483                pts_act[:, 1] = scals * warp_yfactor * scale_mesh_factors[1]
484        if warp_zfactor:
485            scals = msh.pointdata[0]
486            if len(scals) > 0:
487                pts_act = msh.coordinates
488                pts_act[:, 2] = scals * warp_zfactor * scale_mesh_factors[2]
489        if warp_yfactor or warp_zfactor:
490            # msh.points(pts_act)
491            msh.coordinates = pts_act
492            if vmin is not None and vmax is not None:
493                msh.mapper.SetScalarRange(vmin, vmax)
494
495        if scbar and c is None:
496            if "3d" in scbar:
497                msh.add_scalarbar3d()
498            elif "h" in scbar:
499                msh.add_scalarbar(horizontal=True)
500            else:
501                msh.add_scalarbar(horizontal=False)
502
503        if len(isolns) > 0:
504            ison = isolns.pop("n", 10)
505            isocol = isolns.pop("c", "black")
506            isoalpha = isolns.pop("alpha", 1)
507            isolw = isolns.pop("lw", 1)
508
509            isos = msh.isolines(n=ison).color(isocol).lw(isolw).alpha(isoalpha)
510
511            isoz = isolns.pop("z", None)
512            if isoz is not None:  # kind of hack to make isolines visible on flat meshes
513                d = isoz
514            else:
515                d = msh.diagonal_size() / 400
516            isos.z(msh.z() + d)
517            actors.append(isos)
518
519        actors.append(msh)
520
521
522    #################################################################
523    if "arrow" in mode or "line" in mode:
524        if "arrow" in mode:
525            arrs = create_arrows(u, scale=scale)
526        else:
527            arrs = create_lines(u, scale=scale)
528
529        if arrs:
530            if legend and "mesh" not in mode:
531                arrs.legend(legend)
532            if c:
533                arrs.color(c)
534                arrs.color(c)
535            if alpha:
536                arrs.alpha(alpha)
537            actors.append(arrs)
538
539    #################################################################
540    for ob in inputobj:
541        inputtype = str(type(ob))
542        if "vedo" in inputtype:
543            actors.append(ob)
544
545    if text:
546        actors.append(text)
547
548    if "at" in options and "interactive" not in options:
549        if vedo.plotter_instance:
550            N = vedo.plotter_instance.shape[0] * vedo.plotter_instance.shape[1]
551            if options["at"] == N - 1:
552                options["interactive"] = True
553
554    if len(actors) == 0:
555        print('Warning: no objects to show, check mode in plot(mode="...")')
556
557    if returnActorsNoShow:
558        return actors
559
560    return show(actors, **options)
Plot the object(s) provided.
Input can be any combination of: Mesh, Volume, dolfin.Mesh,
dolfin.MeshFunction, dolfin.Expression or dolfin.Function.
Return the current Plotter class instance.
Arguments:
- mode : (str)
one or more of the following can be combined in any order
mesh/color, will plot the mesh, by default colored with a scalar if availabledisplacementshow displaced mesh by solutionarrows, mesh displacements are plotted as scaled arrows.lines, mesh displacements are plotted as scaled lines.tensors, to be implemented
- add : (bool) add the input objects without clearing the already plotted ones
- density : (float) show only a subset of lines or arrows [0-1]
- wire[frame] : (bool) visualize mesh as wireframe [False]
- c[olor] : (color) set mesh color [None]
- exterior : (bool) only show the outer surface of the mesh [False]
- alpha : (float) set object's transparency [1]
- lw : (int) line width of the mesh (set to zero to hide mesh) [0.1]
- ps : int set point size of mesh vertices [None]
- z : (float) add a constant to z-coordinate (useful to show 2D slices as function of time)
- legend : (str) add a legend to the top-right of window [None]
- scalarbar : (bool) add a scalarbar to the window ['vertical']
- vmin : (float) set the minimum for the range of the scalar [None]
- vmax : (float) set the maximum for the range of the scalar [None]
- scale : (float) add a scaling factor to arrows and lines sizes [1]
- cmap : (str) choose a color map for scalars
- shading : (str) mesh shading ['flat', 'phong']
- text : (str) add a gray text comment to the top-left of the window [None]
- isolines : (dict)
dictionary of isolines properties
- n, (int) - add this number of isolines to the mesh
- c, - isoline color
- lw, (float) - isoline width
- z, (float) - add to the isoline z coordinate to make them more visible
- warp_zfactor : (float) elevate z-axis by scalar value (useful for 2D geometries)
- warp_yfactor : (float) elevate z-axis by scalar value (useful for 1D geometries)
- scale_mesh_factors : (list) rescale mesh by these factors [1,1,1]
- new : (bool) spawn a new instance of Plotter class, pops up a new window
- at : (int) renderer number to plot to
- shape : (list) subdvide window in (n,m) rows and columns
- N : (int) automatically subdvide window in N renderers
- pos : (list) (x,y) coordinates of the window position on screen
- size : (list) window size (x,y)
- title : (str) window title
- bg : (color) background color name of window
- bg2 : (color) second background color name to create a color gradient
- style : (int)
choose a predefined style [0-4]
- 0,
vedo, style (blackboard background, rainbow color map) - 1,
matplotlib, style (white background, viridis color map) - 2,
paraview, style - 3,
meshlab, style - 4,
bw, black and white style.
- 0,
- axes : (int)
Axes type number.
Axes type-1 can be fully customized by passing a dictionary
axes=dict().- 0, no axes,
- 1, draw customizable grid axes (see below).
- 2, show cartesian axes from (0,0,0)
- 3, show positive range of cartesian axes from (0,0,0)
- 4, show a triad at bottom left
- 5, show a cube at bottom left
- 6, mark the corners of the bounding box
- 7, draw a simple ruler at the bottom of the window
- 8, show the
vtkCubeAxesActorobject, - 9, show the bounding box outLine,
- 10, show three circles representing the maximum bounding box,
- 11, show a large grid on the x-y plane (use with zoom=8)
- 12, show polar axes.
- infinity : (bool) if True fugue point is set at infinity (no perspective effects)
- sharecam : (bool) if False each renderer will have an independent vtkCamera
- interactive : (bool) if True will stop after show() to allow interaction w/ window
- offscreen : (bool) if True will not show the rendering window
- zoom : (float) camera zooming factor
- viewup : (list), str camera view-up direction ['x','y','z', or a vector direction]
- azimuth : (float) add azimuth rotation of the scene, in degrees
- elevation : (float) add elevation rotation of the scene, in degrees
- roll : (float) add roll-type rotation of the scene, in degrees
- camera : (dict)
Camera parameters can further be specified with a dictionary
assigned to the
camerakeyword: (E.g.show(camera={'pos':(1,2,3), 'thickness':1000,}))pos,(list), the position of the camera in world coordinatesfocal_point,(list), the focal point of the camera in world coordinatesviewup,(list), the view up direction for the cameradistance,(float), set the focal point to the specified distance from the camera position.clipping_range,(float), distance of the near and far clipping planes along the direction of projection.parallel_scale,(float), scaling used for a parallel projection, i.e. the height of the viewport in world-coordinate distances. The default is 1. Note that the "scale" parameter works as an "inverse scale", larger numbers produce smaller images. This method has no effect in perspective projection mode.thickness,(float), set the distance between clipping planes. This method adjusts the far clipping plane to be set a distance 'thickness' beyond the near clipping plane.view_angle,(float), the camera view angle, which is the angular height of the camera view measured in degrees. The default angle is 30 degrees. This method has no effect in parallel projection mode. The formula for setting the angle up for perfect perspective viewing is: angle = 2*atan((h/2)/d) where h is the height of the RenderWindow (measured by holding a ruler up to your screen) and d is the distance from your eyes to the screen.