 Fork me on GitHub
A python module for scientific analysis and visualization of эd objects
Quick Start
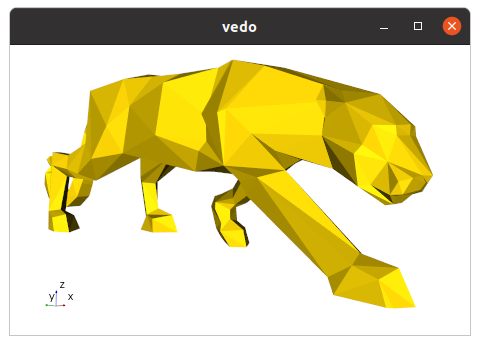
To visualize a file from a web URL (or from your Dropbox!),
simply type in your terminal:
pip install vedo
vedo https://vedo.embl.es/examples/data/panther.stl.gz
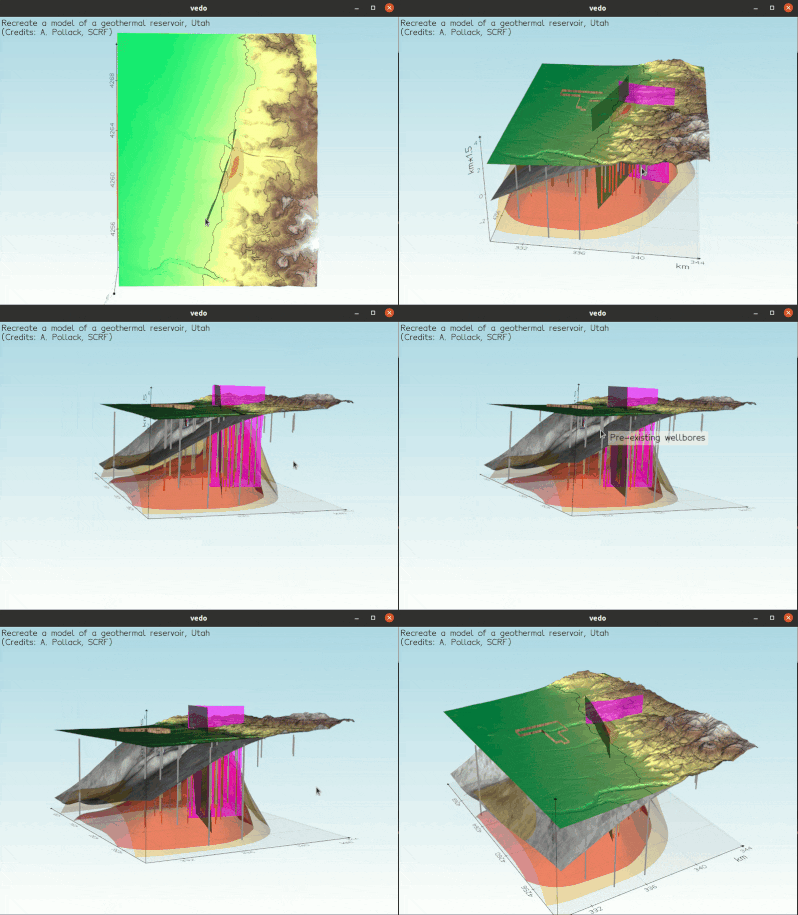
To visualize a full 3D interactive scene, type:
vedo https://vedo.embl.es/examples/geo_scene.npz
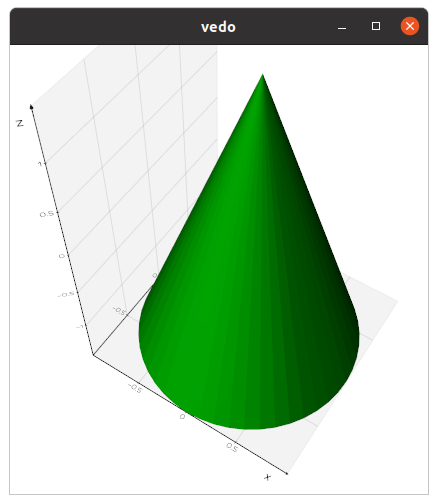
Let's create an interactive 3D scene with a simple cone,
in 3 lines of python code:
from vedo import Cone

# Create a simple cone
c = Cone()

# Show it (with axes)
c.show(axes=1)


# Now you can interact with the 3D scene,
# Press "h" and explore the possibilities!
Let's write a simple python script that loads a polygonal Mesh and generates
a cool rendering by adding some custom light sources to the scene:
from vedo import *

# Load a polygonal mesh, make it white and glossy:
man = Mesh('https://vedo.embl.es/examples/data/man.vtk')
man.c('white').lighting('glossy')

# Create two points:
p1 = Point([ 1,0,1], c='yellow')
p2 = Point([-1,0,2], c='red')

# Add colored light sources at the point positions:
l1 = Light(p1, c='yellow')
l2 = Light(p2, c='red')

# Show everything in one go:
show("Hello World", man, l1, l2, p1, p2, axes=True)
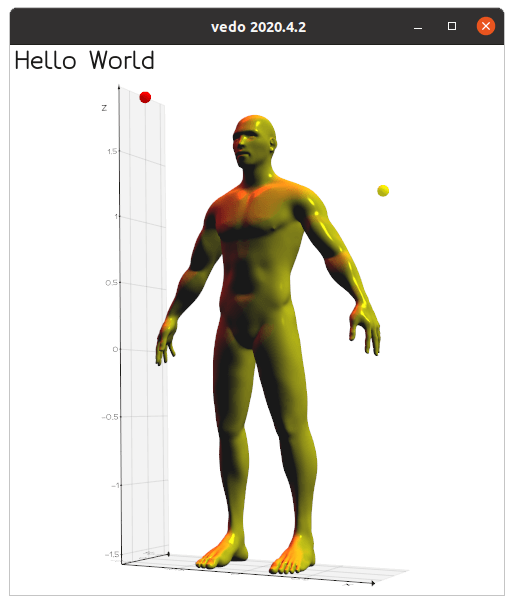
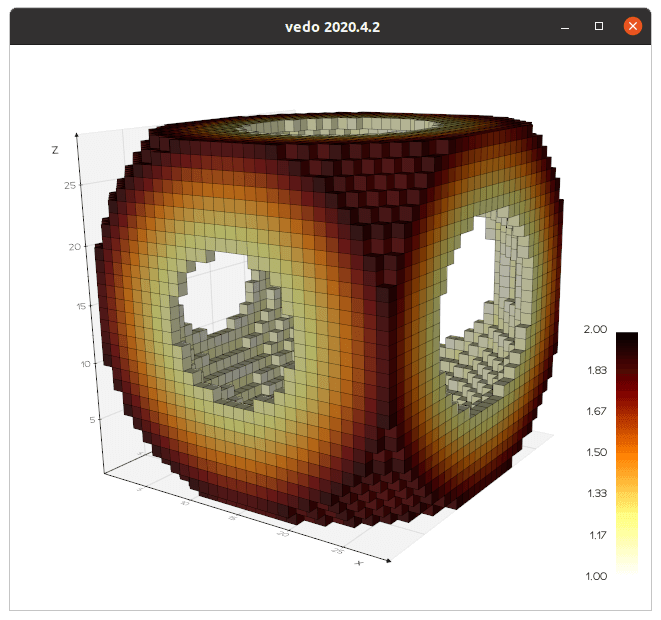
Let's create a Volume, a volumetric dataset, from a
numpy array:
import numpy as np
from vedo import *

# Create a scalar field: the distance from point (15,15,15)
X, Y, Z = np.mgrid[:30, :30, :30]
scalar_field = ((X-15)**2 + (Y-15)**2 + (Z-15)**2)/225

# Create the Volume from the numpy object
vol = Volume(scalar_field)

# Generate the surface that contains all voxels in range [1,2]
lego = vol.legosurface(1,2).cmap("afmhot_r").add_scalarbar()

show(lego, axes=True)
References
Scientific publications leveraging
vedo:
-
X. Diego et al.,
"Key features of Turing systems are determined purely by network topology",
Phys. Rev. X 8, 021071, 20 June 2018,
DOI.
-
M. Musy, K. Flaherty et al.,
"A Quantitative Method for Staging Mouse Limb Embryos based on Limb Morphometry",
Development, (2018) 145 (7): dev154856,
DOI.
-
F. Claudi, A. L. Tyson, T. Branco,
"Brainrender. A python based software for visualisation of neuroanatomical and morphological data.",
eLife 2021;10:e65751,
DOI.
- J. S. Bennett, D. Sijacki,
"Resolving shocks and filaments in galaxy formation simulations: effects on gas properties and star formation in the circumgalactic medium",
Monthly Notices of the Royal Astronomical Society, Volume 499, Issue 1, November 2020,
DOI.
-
A. Pollack et al.,
"Stochastic inversion of gravity, magnetic, tracer, lithology, and fault data for geologically realistic structural models: Patua Geothermal Field case study"
Geothermics Volume 95, September 2021,
DOI.
- X. Lu et al.,
"3D electromagnetic modeling of graphitic faults in the Athabasca Basin using a finite-volume time-domain approach with unstructured grids",
GeophysicsJune 2021,
DOI.
-
M. Deepa Maheshvare et al.,
"A Graph-Based Framework for Multiscale Modeling of Physiological Transport",
Front. Netw. Physiol. 1:802881,
DOI.
-
F. Claudi, T. Branco,
"Differential geometry methods for constructing manifold-targeted recurrent neural networks",
bioRxiv 2021.10.07.463479,
DOI.
-
G. Dalmasso et al.,
"4D reconstruction of developmental trajectories using spherical harmonics",
bioRxiv 2021.12.16.472948,
DOI.
-
J. Klatzow, G. Dalmasso, N. Martínez-Abadías, J. Sharpe, V. Uhlmann,
"µMatch: 3D shape correspondence for microscopy data",
Front. Comput. Sci., 15 February 2022,
DOI.
-
D.J.E Waibel et al.,
"Capturing Shape Information with Multi-scale Topological Loss Terms for 3D Reconstruction".
Lecture Notes in Computer Science, vol 13434. Springer, Cham.
DOI.
Presentations at Conferences:
-
M. Musy, G. Dalmasso, J. Sharpe and N. Sime,
"Plotting in FEniCS with python",
Poster
at FEniCS'2019,
SDTM, Washington DC, June 2019.
-
G. Dalmasso,
"Evolution in space and time of 3D volumetric images".
Talk at Image-based Modeling and Simulation of Morphogenesis.
Max Planck Institute for the Physics of Complex Systems, Dresden, Germany, March 2019.
-
G. Dalmasso,
"A four-dimensional growing mouse limb bud reconstruction".
Talk at SEBD, Spain, November 2020.
-
M. Musy,
"vedo. A python module for scientific analysis and visualization of 3D data".
Seminar at MOIA
(Microscopy Optics and Image Analysis), Heidelberg, November 2021.
Cite
vedo as:
-
M. Musy et al.,
"
vedo, a python module for scientific analysis and visualization of 3D objects and point clouds",
Zenodo, 10.5281/zenodo.2561401.
